Additional
interesting items on the technology and history
What's on
this page?
Seven
Sisters and
Standard Oil heritage
of major companies
Oil
Price Chart
Largest
Oil
Producing Countries
Largest
US Oil Fields
Largest
Oil Fields
in the World
Countries
with Large Natural Gas Reserves
Largest Natural Gas
Fields in the World
Sources of US Oil
Imports
Where your gasoline
dollars go
Plus
assorted facts
in the text sections
|
NEW: A
map showing the sources of US oil imports has been added
at the bottom of the page, as well as a table showing
where your gasoline dollar goes. There's also a new
link to "Largest Oil Companies," and several items have
been updated.
 US OIL
DEMAND, 2004: Over 20
million barrels per day, up from January 2002, when
demand was about 18.5 million barrels per day, = 777 million
gallons. If lined up in 1-gallon cans, they
would encircle the earth at the equator almost 6 times
(about 147,000 miles of cans) — every day.
Here's another image: EVERY DAY, the US consumes enough
oil to cover a football field with a column of oil 2500
feet tall. That's 121 million cubic feet. 55-60% of US
consumption is imported at a cost of $50 billion+ per year,
amounting to the largest single element of our trade
deficit. In summer 2004, thanks to higher prices,
increased demand, and lower production, record trade
deficits of more than $50 billion per month were recorded,
with approximately 30% of that attributable to imported
energy costs. In September 2004, the US reported its lowest
monthly oil production in 55 years, at an average of
4.85 million barrels per day. US OIL
DEMAND, 2004: Over 20
million barrels per day, up from January 2002, when
demand was about 18.5 million barrels per day, = 777 million
gallons. If lined up in 1-gallon cans, they
would encircle the earth at the equator almost 6 times
(about 147,000 miles of cans) — every day.
Here's another image: EVERY DAY, the US consumes enough
oil to cover a football field with a column of oil 2500
feet tall. That's 121 million cubic feet. 55-60% of US
consumption is imported at a cost of $50 billion+ per year,
amounting to the largest single element of our trade
deficit. In summer 2004, thanks to higher prices,
increased demand, and lower production, record trade
deficits of more than $50 billion per month were recorded,
with approximately 30% of that attributable to imported
energy costs. In September 2004, the US reported its lowest
monthly oil production in 55 years, at an average of
4.85 million barrels per day.
 US demand for
natural gas is increasing, and production in many long-time
prime producing areas (e.g. the Gulf Coast) is diminishing
to the point of near-total depletion. Without
significant increases in drilling (well beyond anticipated
levels), demand is predicted to significantly exceed supply
soon. By 2000, US demand (22.2 tcf/year) exceeded
production (18.7 tcf/year) enough that about 14% of our
natural gas was being imported from Canada. This may
provide a window of opportunity for explorationists and
producers (especially smaller operators), and may improve
the domestic market for geoscientists. Note that it is
currently impossible (without complex liquification) to
transport natural gas across oceans -- so huge gas reserves
in the Nile Delta, for example, are irrelevant to US needs. US demand for
natural gas is increasing, and production in many long-time
prime producing areas (e.g. the Gulf Coast) is diminishing
to the point of near-total depletion. Without
significant increases in drilling (well beyond anticipated
levels), demand is predicted to significantly exceed supply
soon. By 2000, US demand (22.2 tcf/year) exceeded
production (18.7 tcf/year) enough that about 14% of our
natural gas was being imported from Canada. This may
provide a window of opportunity for explorationists and
producers (especially smaller operators), and may improve
the domestic market for geoscientists. Note that it is
currently impossible (without complex liquification) to
transport natural gas across oceans -- so huge gas reserves
in the Nile Delta, for example, are irrelevant to US needs.
UPDATE:
Hiring of newly graduated geoscientists has increased
dramatically in Fall 1996. FURTHER UPDATE: The "boomlet" of
1996-97 became the bust of 1998, when the price of oil fell
to below $10.00 per barrel, and thousands were laid off. By
late 1999, things were looking up again. The short-term of
the cycle swings is taking many people by surprise. For much
of 2000-2002, prices have been fairly stable in the $20s per
barrel.
US PRODUCTION, early 2002: About
5.9 million barrels of oil per day, plus about 2 million
barrels of natural gas liquids and condensate; and 55
billion cubic feet of gas per day. Oil production is a
decline from 8-9 million b/d in 1986.
World's other largest producers: Former
USSR (once the world's largest producer) production
has declined more than 30% since 1988, from more than 12 to
about 8 million barrels per day. Saudi Arabia produces
about 5 to 9 million barrels per day (7.3 million in early
2002; production depends more on OPEC quotas and prices than
on real capability).
US Production capacity, about 8
million barrels per day, is accomplished with about 533,000
oil wells, averaging less than 17 barrels per well per
day. Saudi capacity, similar at about 8-9 million
barrels per day, is from 750 wells — averaging more
than 12,000 barrels per well per day. The best well in the
onshore 48 states is in Grant Canyon Field, Nevada,
producing about 4000 barrels per day from sucrosic Devonian
dolomites in a small fault block. UPDATE: 1997
discoveries in the Williston Basin are producing up to 6,000
barrels per day from Mississippian Lodgepole carbonate
mounds.
These are the best
wells in the onshore 48 states in decades -- but the
Gulf
of Mexico is the US hot
spot for current exploration and production.
Oil and Gas are
used for much more than fuel. Every time you brush your
teeth (nylon bristles), drink milk or soda from a plastic
container, or play a plastic CD,
And let's not forget that 57% of the US's
electricity is still generated by burning coal -- although
almost all of the rest comes from burning oil or gas.
In terms of total US energy
usage, the breakdown by source is given in the following table
(for late 2001):
| Energy Source |
Percentage of total |
| Petroleum |
42%
|
| Coal |
24%
|
| Natural Gas |
20%
|
| Nuclear |
8%
|
| Hydro power |
2%
|
| Solar, Wind, etc. |
2%
|
In contrast to US
usage, France obtains about 75% of its electricity supply from
nuclear energy sources.
The US oil industry lost
more than 1,000,000 jobs from 1986-92, more than the
more-publicized auto and steel industries combined.
Seven Sisters
& Standard Oil
The original Seven Sisters were
Exxon (or Esso, Humble, Standard of NJ), Shell, BP
(British Petroleum, originally Burmah Oil + Anglo-Iranian),
Gulf, Texaco, Mobil (Standard of NY, or
Socony-Vacuum), and Chevron (Standard of
California). Since Gulf Oil no longer exists (acquired by
Chevron in 1984) except as Gulf Canada and a marketing
company in the northeast US, Amoco (Standard of
Indiana) was often added to the list of six; but in 1998,
Amoco was acquired by BP to form BP Amoco, while Exxon was
acquiring Mobil; and Chevron and Texaco merged in 2001-2002.
LARGEST OIL COMPANIES
As noted above, Exxon and Mobil have
merged, and BP Amoco acquired ARCO. If I have counted
correctly, three
companies, BP Amoco, ExxonMobil, and ChevronTexaco,
combine within them no fewer than 14
of the 35 Standard Oil Trust companies that were divested
from Standard in 1911. For much more, and more
authoritative, information about Standard Oil and its
history, visit
"Whatever Happened to Standard Oil."
 A 28-year oil price chart is given below. A 28-year oil price chart is given below.
(data from
Energy Information Administration, chart by Gibson Consulting)
OIL
In the history of the world,
according to AAPG presidential address, April 1993,
|
WORLD
PRODUCTION/CONSUMPTION: Production in
2000-2002 was about 75 million barrels
per day, about equal to the world
consumption of about 27 billion barrels
per year. Consumption is increasing at
a faster rate than the increase in
production.
20
largest oil producers as of July 1999, in
million barrels per day:
(source: mostly Oil & Gas Journal, World
Oil, and EIA; for 2002, includes condensate
& natural gas liquids, which explains
the apparent jump in US production. USA
still produces about 5.9 mb/d oil.)
|
20 largest oil
producers
| Country |
Production |
Rank & Production
Early 2002 |
 1. Saudi Arabia 1. Saudi Arabia |
7.7 million barrels/day |
3. 7.7 mb/d |
| 2. Former Soviet Union |
7.1 million barrels/day |
1. 8.6 mb/d |
| 3. USA |
5.9 million barrels/day |
2. 8.1 mb/d |
| 4. Iran |
3.6 million barrels/day |
4. 3.7 mb/d |
| 5. China |
3.2 million barrels/day |
7. 3.3 mb/d |
| 6. Norway |
3.0 million barrels/day |
6. 3.4 mb/d |
| 7. Mexico |
3.0 million barrels/day |
5. 3.6 mb/d |
| 8. Venezuela |
2.8 million barrels/day |
8. 2.8 mb/d |
| 9. United Kingdom |
2.7 million barrels/day |
10. 2.6 mb/d |
| 10. Iraq |
2.5 million barrels/day |
11. 2.4 mb/d |
| 11. United Arab Emirates |
2.1 million barrels/day |
12. 2.2 mb/d |
| 12. Nigeria |
2.0 million barrels/day |
13. 2.1 mb/d |
| 13. Kuwait |
1.9 million barrels/day |
14. 1.7 mb/d |
| 14. Canada |
1.9 million barrels/day |
9. 2.8 mb/d |
| 15. Libya |
1.3 million barrels/day |
16. 1.4 mb/d |
| 16. Indonesia |
1.3 million barrels/day |
17. 1.2 mb/d |
| 17. Brazil |
1.1 million barrels/day |
15. 1.6 mb/d |
| 18. Oman |
0.9 million barrels/day |
18. 1.0 mb/d |
| 19. Egypt |
0.9 million barrels/day |
21. 0.75 mb/d |
| 20. Colombia |
0.8 million barrels/day |
29. 0.62 mb/d |
In 1996, the USA was the world's leading producer, with
about 7.5 million barrels per day.
Note: Former Soviet Union production has dropped from the highest
in the world, at around 12 million b/d in the late
1980s, but it has stabilized since 1993 and began to
increase significantly by 1998. 86% of "former Soviet Union"
production is from Russia, with Kazakstan at 7% and
Azerbaijan at 3%.
The 20 countries on this list produce about 57 million b/d,
about 87% of world production. OPEC countries
account for about 24 million b/d, or 40% of world
production.
Are you surprised to see Norway so high on this list?
There are very few sedimentary rocks onshore Norway. All of
this production comes from offshore, in the North Sea.
|
Texas
contains/contained about 15 billion barrels
(East Texas Field, at about 5 billion, is the
largest field in the 48 states. It is a
regional stratigraphic trap in Upper
Cretaceous fluvio-deltaic sandstones.)
Prudhoe Bay = about 9-10
billion barrels. It is a broad culmination on
the Barrow Arch, and the reservoirs are
transgressive marine to non-marine
conglomerates and sandstones of Triassic age.
The reservoir contains a lot of gas, too.
|
|
The following table is based on various sources
and is as accurate as I could make it. It
represents CUMULATIVE production, not
current production, PLUS estimated reserves, so
it is a measure of all the oil that was/is
contained in the fields. Some, such as most of
the California fields, have been producing since
the 1930s and are significantly depleted. Most
(more than 10 billion barrels) of Prudhoe Bay's
oil has been produced. |
10 largest oil
fields in the US
| Field, State |
Cumulative Production
+ Est. Reserves |
| 1. Prudhoe Bay, Alaska |
10+ billion barrels |
| 2. East Texas |
6.0 billion barrels |
| 3. Wilmington, California |
2.8 billion barrels |
| 4. Midway-Sunset,
California |
2.2 billion barrels |
| 5. Kern River, California |
1.95 billion barrels |
| 6. Yates, West Texas |
1.95 billion barrels |
| 7. Wasson, Texas |
1.8 billion barrels |
| 8. Elk Hills, California |
1.5 billion barrels |
| 9. Kuparuk River, Alaska |
1.5 billion barrels |
| 10. Panhandle, Texas |
1.4 billion barrels |
|
The largest
oil field in the world (Ghawar in Saudi
Arabia) contains an estimated ultimate
recoverable 75 billion barrels of oil, or
more than seven times Prudhoe Bay, in Upper
Jurassic shallow-water carbonates in a broad
anticline.
Chevron is working
with Kazakstan and others to develop the
huge Tengiz field near the Caspian
Sea (estimates run from 15 to 26 billion
barrels recoverable, from what amounts to an
oil-filled paleo-atoll, or reef) with a goal
of producing about 700,000 barrels per
day from this one field -- equal to
more than 10% of the oil production of the
entire United States.
|
|
Numbers in the following table are mostly
ranges for estimated ultimate recoverable
reserves. Sometimes you see larger numbers
that represent original oil in place -- all of
which cannot be produced. Some of the fields
in this list are essentially completely
depleted (e.g., Romashkino). |
21 largest
oil fields
in the World
| Field, Country |
Size estimate |
| 1. Ghawar, Saudi Arabia |
75-83 billion barrels |
| 2. Burgan, Kuwait |
66-72 billion barrels |
| 3. Bolivar Coastal,
Venezuela |
30-32 billion barrels |
| 4. Safaniya-Khafji,
Saudi Arabia/Neutral Zone |
30 billion barrels |
| 5. Rumaila, Iraq |
20 billion barrels |
| 6. Tengiz, Kazakstan |
15-26 billion barrels |
| 7. Ahwaz, Iran |
17 billion barrels |
| 8. Kirkuk, Iraq |
16 billion barrels |
| 9. Marun, Iran |
16 billion barrels |
| 10. Gachsaran, Iran |
15 billion barrels |
| 11. Aghajari, Iran |
14 billion barrels |
| 12. Samotlor, West
Siberia, Russia |
14-16 billion barrels |
| 13. Abqaiq, Saudi
Arabia |
12 billion barrels |
| 14. Romashkino,
Volga-Ural, Russia |
12-14 billion barrels |
| 15. Chicontepec, Mexico |
12 billion barrels |
| 16. Berri, Saudi Arabia |
12 billion barrels |
| 17. Zakum, Abu Dhabi,
UAE |
12 billion barrels |
| 18. Manifa, Saudi
Arabia |
11 billion barrels |
| 19. Faroozan-Marjan,
Saudi Arabia/Iran |
10 billion barrels |
| 20. Marlim, Campos,
Brazil |
10-14 billion barrels |
| 21.Prudhoe Bay, Alaska,
USA |
9.9 billion barrels |
Natural Gas
|
The largest gas fields in
the world are in the West Siberian
Basin (including Urengoy, Yamburg,
Zapolyarnoye), and contain more gas (well
over 1200 trillion cubic feet for
the whole basin) than in all the known gas
fields in the US, including Alaska (the US
has a lot of additional gas associated
with oil fields). Reservoirs are
Cretaceous fluvial clastics in drape
anticlines above Triassic-Jurassic horsts.
|
|
The
following table shows estimated proved
gas reserves for the top 12
countries. Numbers for gas reserves may be
misleading, as they may or may not include
"associated" gas (as in associated with
oil fields). Other estimates, for example,
put Canada much higher on the list. Source
for both of the following tables is mostly
the US Energy Information
Administration, which has a very useful web
site for statistics. |
12 top
natural gas countries
(by reserves)
| Country |
Reserve estimate |
| World |
4,980 trillion cubic feet |
| 1. Russia |
1,748 trillion cubic feet |
| 2. USA |
1,475 trillion cubic feet |
| 3. Iran |
742 trillion cubic feet |
| 4. Qatar |
245 trillion cubic feet |
| 5. Abu Dhabi |
188 trillion cubic feet |
| 6. Saudi Arabia |
185 trillion cubic feet |
| 7. Venezuela |
140 (maybe 450) trillion
cubic feet |
| 8. Algeria |
128 trillion cubic feet |
| 9. Turkmenistan |
100 (maybe 535) trillion
cubic feet |
| 10. Kazakstan |
83 trillion cubic feet |
| 11. Canada |
67 trillion cubic feet |
| 12. Uzbekistan |
60 trillion cubic feet |
| Specific
values for gas field sizes are even harder
to pin down. The following list is not
necessarily in exact order and would
change with other estimators; it is not
perfectly clear in each case whether
cumulative production or estimated
remaining reserves is meant. There are
some 20 fields in West Siberia that exceed
35 TCF each. Use this table as a
starting point. Numbers are in
trillion cubic feet (TCF) and should be
viewed as ball-park figures. |
22 largest natural gas fields
in the World
| Field, Country |
Size estimate |
| 1. Urengoy, West
Siberia, Russia |
>275 trillion cubic
feet |
| 2. Yamburg, West
Siberia, Russia |
prob. >200 trillion
cubic feet |
| 3. Orenburg, Volga
Region, Russia |
prob. >200 trillion
cubic feet |
| 4. Schtockmanov,
Barents Sea, Russia |
prob. >200 trillion
cubic feet |
| 5. North Dome,
Qatar |
241 trillion cubic feet |
| 6. Umm Shaif + Abu
el-Bukush, Abu Dhabi |
175 trillion cubic feet |
| 7. Zapolyarnoye,
West Siberia, Russia |
150+ trillion cubic feet |
| 8. Kharasevey, West
Siberia, Russia |
150+ trillion cubic feet |
| 9. Bovanenko, West
Siberia, Russia |
125 trillion cubic feet |
| 10. Medvezh'ye,
West Siberia, Russia |
100+ trillion cubic feet |
| 11. Hassi R'Mel,
Algeria |
100 trillion cubic feet |
| 12. South Pars,
Iran |
100 trillion cubic feet |
| 13.
Panhandle-Hugoton, USA (TX-OK-KS) |
80 trillion cubic feet |
| 14. Groningen,
Netherlands |
66 trillion cubic feet |
| 15. Ghawar Oil
Field, Saudi Arabia |
60 trillion cubic feet |
| 16. North Pars,
Iran |
48 trillion cubic feet |
| 17.
Dauletabad-Donmez, Turkmenistan |
47 trillion cubic feet |
| 18. Karachaganak,
Kazakstan |
46 trillion cubic feet |
| 19. Shatlyk,
Turkmenistan |
35 trillion cubic feet |
| 20. Yashlar,
Turkmenistan |
27 trillion cubic feet |
| 21. Blanco (San
Juan), USA (NM) |
23 trillion cubic feet |
| 22. Gazli,
Uzbekistan |
20 trillion cubic feet |
USA
|
In the U.S.,
about 35% of oil and gas
production comes from reservoirs
of Tertiary age (largely in the
Gulf Coast and California);
about 25% is from
reservoirs of Pennsylvanian age
(West Texas, Rockies,
Midcontinent), and about 12%
is from reservoirs of Cretaceous
age. Sandstone reservoirs
account for 70% of
fields; limestone = 16%;
dolomite = 11%.
The Offshore
US Gulf of Mexico has
become one of the "hottest"
exploration areas in the world,
just a few years after many had
declared it the "Dead Sea" for
exploration potential. Dramatic
improvements in 3-D Seismic
technology (increasing
success rates to as much as 80%,
up from less than 40%) and
deepwater drilling methodology
are largely the basis for this
resurgence. And several very
nice discoveries have not hurt
one bit. Reserves in discovered
deep-water (>500 meters)
fields alone are estimated at
nearly 1.5 billion barrels,
with two fields (Shell's Mars
and BP's Crazy Horse, renamed
Thunder Horse) at about
100,000,000 barrels or more.
The top
ten producing states by current
(early 2002) daily production are
Louisiana, Texas, Alaska,
California, New Mexico,
Oklahoma, Wyoming, Kansas, North
Dakota, and Mississippi.
Illinois is not a present-day big
producer, but until about 1970,
Illinois was the 4th largest
cumulative producer of oil (after
TX, LA, and OK).
IN 1994,
U.S. OIL IMPORTS EXCEEDED
50% OF CONSUMPTION FOR THE
FIRST TIME. In 1999, US
imports were about 11
million barrels per day,
compared to our domestic
production of 6 million
barrels per day. You do the
math.
|
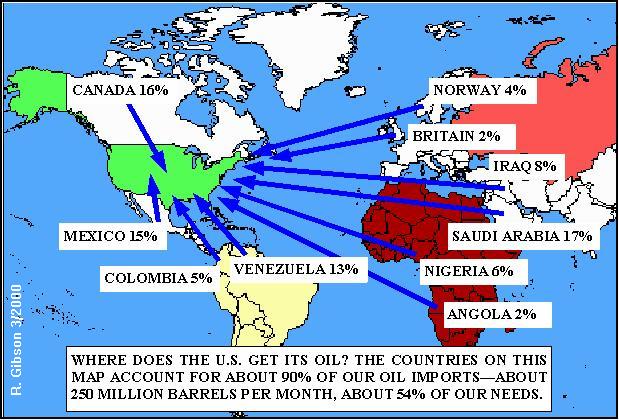
SOURCES OF
US OIL IMPORTS
|
The
Map below is based on data from
Energy Information Administration
for December, 1999. Note that the
"Big Four"—Saudi Arabia, Canada,
Mexico, and Venezuela—alternate
their ranks fairly often. Some
months Venezuela is No. 1,
sometimes it is Canada. Something
like 15% of our imports come from
each of these countries. (Note: on
the map, 250 million barrels and
54% refer to our total imports,
including the 10% that comes from
countries not indicated, such as
Kuwait, Algeria, the United Arab
Emirates, and Indonesia.)
|
|
One
barrel of crude oil makes about
19½ gallons of gasoline, 9 gallons
of fuel oil, 4 gallons of jet
fuel, and 11 gallons of other
products, including lubricants,
kerosene, asphalt, and
petrochemical feedstocks to make
plastics. The ultimate cost of a
gallon of gas at the service
station depends mostly on the
price of crude oil, and most of
the profit after expenses goes to
the owner-producers of the oil,
whether they are governments or
oil producing companies. The
following table shows an
approximate breakdown of the costs
that go into a gallon of gas in
the US. Almost everywhere in the
world outside the US, people pay
MUCH more for gasoline, largely
because of much larger government
taxes, which amount to around $3
to $4 per gallon in many European
countries. In the categories
"Production cost" and "Producer
profit" the values show a range
from Saudi Arabian production to
USA production. Naturally, all the
other values may vary some as
well; these are general estimates.
|
Costs to
produce and sell a gallon of gasoline in the
US
| Expense |
Amount |
| Production
cost |
15¢ to 60¢ |
| Producer
profit |
53¢ to 8¢ |
| Refining cost |
13¢ |
| Marketing
cost |
5¢ |
| Transportation
cost |
15¢ |
| Retailer cost |
6¢ |
Refiner,
marketer,
transp. & retailer profit |
10¢ |
| US Taxes |
19¢ |
| Average state
taxes |
23¢ |
| TOTAL |
$1.59 |
|
If
you're paying less than $1.59,
it probably means that the
independent gas dealer on the
corner is only getting a profit
of 1¢ or 2¢ a gallon rather than
the 5¢ or 6¢ average, or else
the price of oil has gone down
and the owner-producers' profits
are less. A higher cost may mean
it is summer, when special
refining is required for
oxygenated fuels, and it costs
more to produce more for
increased demand.
|
Thanks to
Dick Gibson
Gibson
Consulting, 301 N. Crystal St., Butte, MT
59701
E-mail your questions
and comments
|


